Program In VS Code
This is the primary truST engineering workflow.
Start with the shipped tutorial project in desktop VS Code.
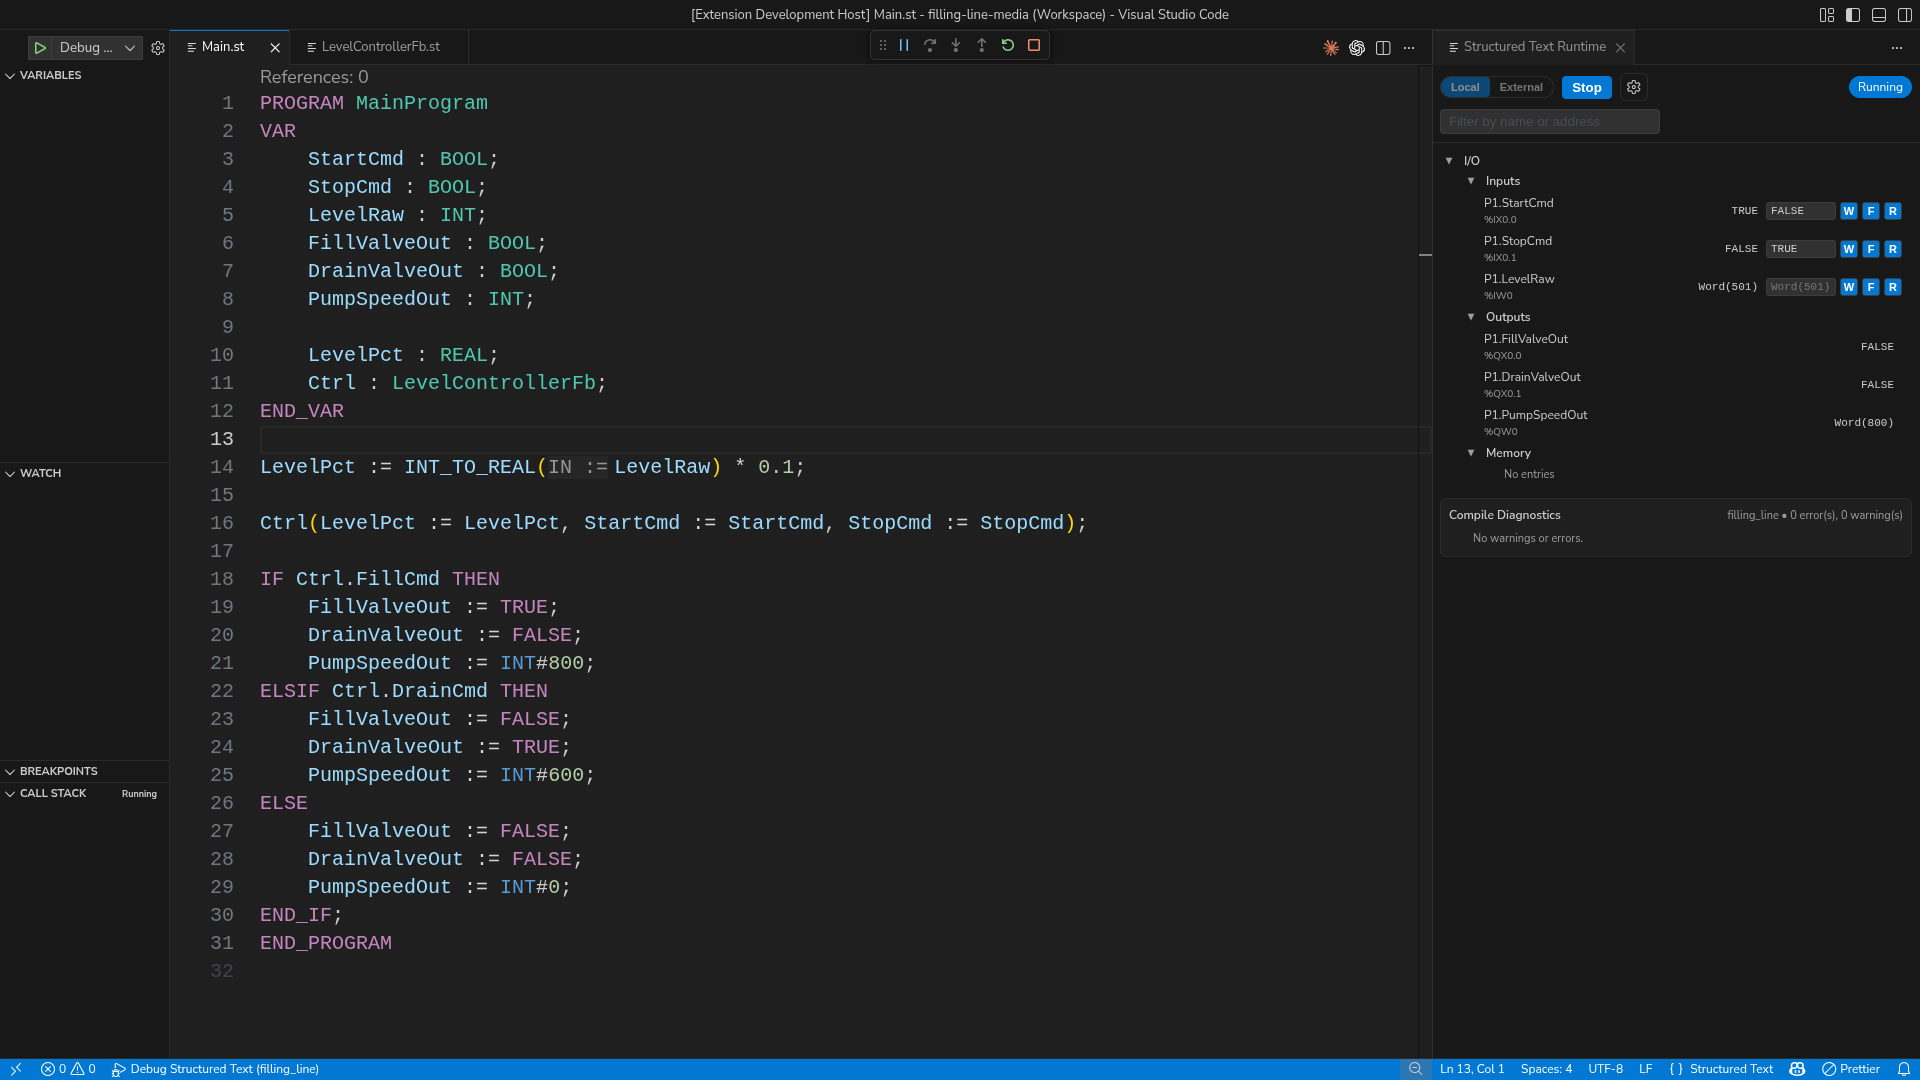
Figure: Desktop VS Code with Structured Text code, the runtime panel docked on the right, live I/O, memory, and compile diagnostics in one window.
What You Get In One Window
- IEC-aware diagnostics and semantic highlighting
- go to definition, references, rename, and formatting
- the runtime panel with live I/O and memory
- the debugger with breakpoints, stepping, locals, and call stack
Use A Shipped Project First
Start with a shipped tutorial:
examples/tutorials/12_hmi_pid_process_dashboard
Open it:
code examples/tutorials/12_hmi_pid_process_dashboard
Quick Start
- Install
truST LSP. - Open the tutorial project in VS Code.
- Open
src/main.standsrc/config.st. - Run
Structured Text: Open Runtime Panel. - Start the runtime in
Localmode. - Inspect
%I,%Q, and memory values in the runtime panel. - Set a breakpoint inside the control logic and press
F5. - Rename or jump to the control function block to confirm the LSP flow.
- Open
/hmionly after the editor-side behavior makes sense.
IEC-Aware Diagnostics
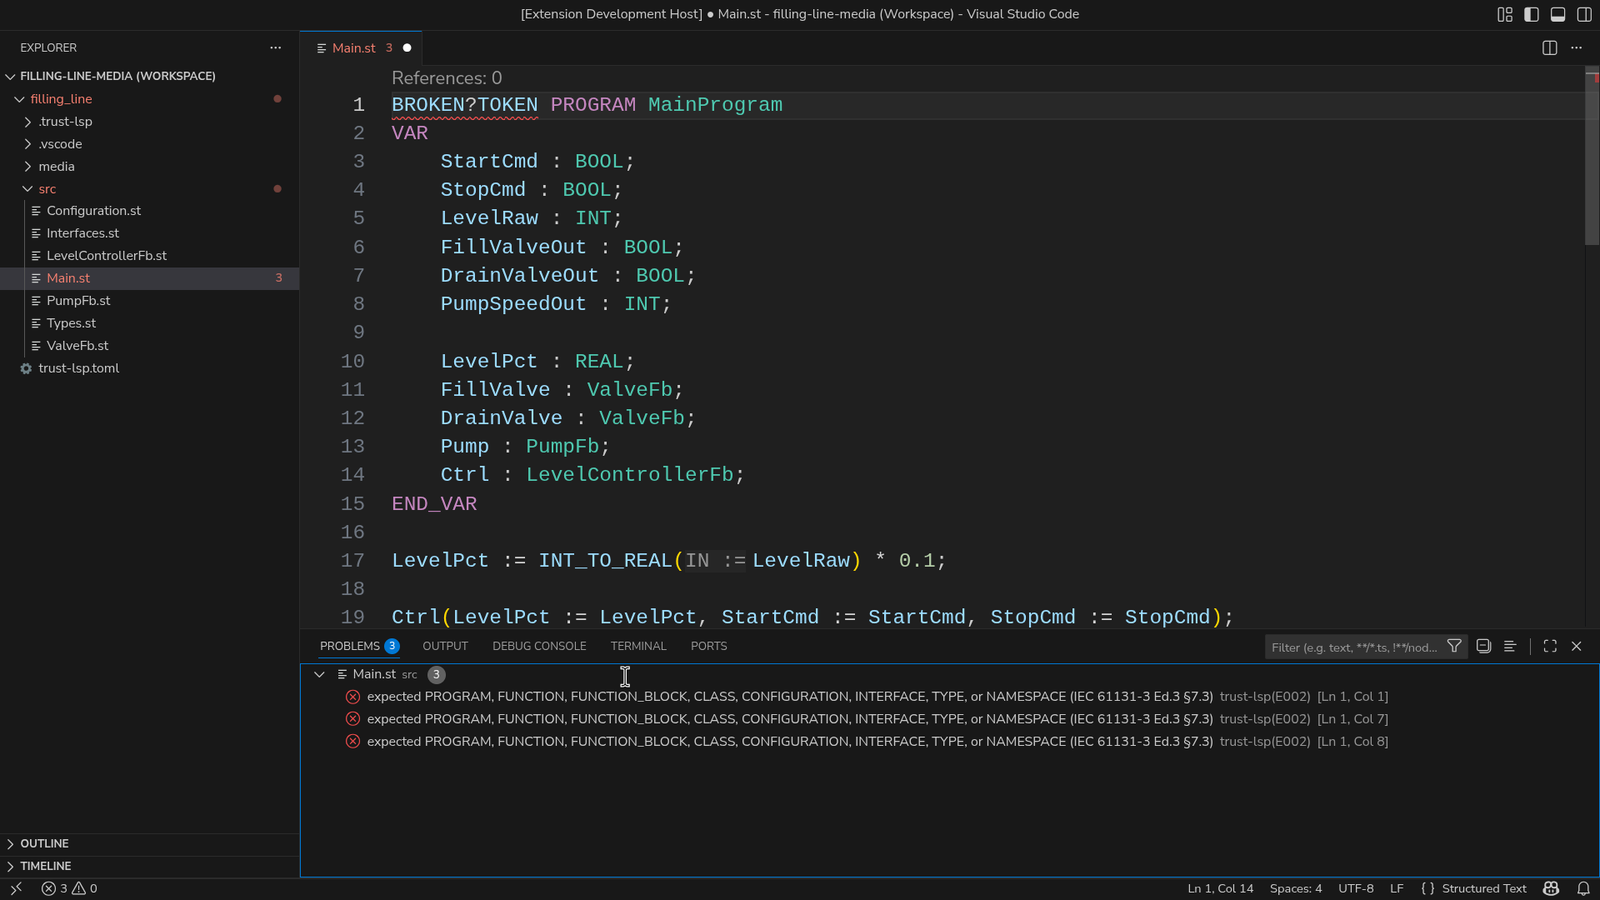
Figure: The Problems panel reports the IEC rule directly, so the editor tells you what language rule was broken instead of only showing a generic parser failure.
Debug Live
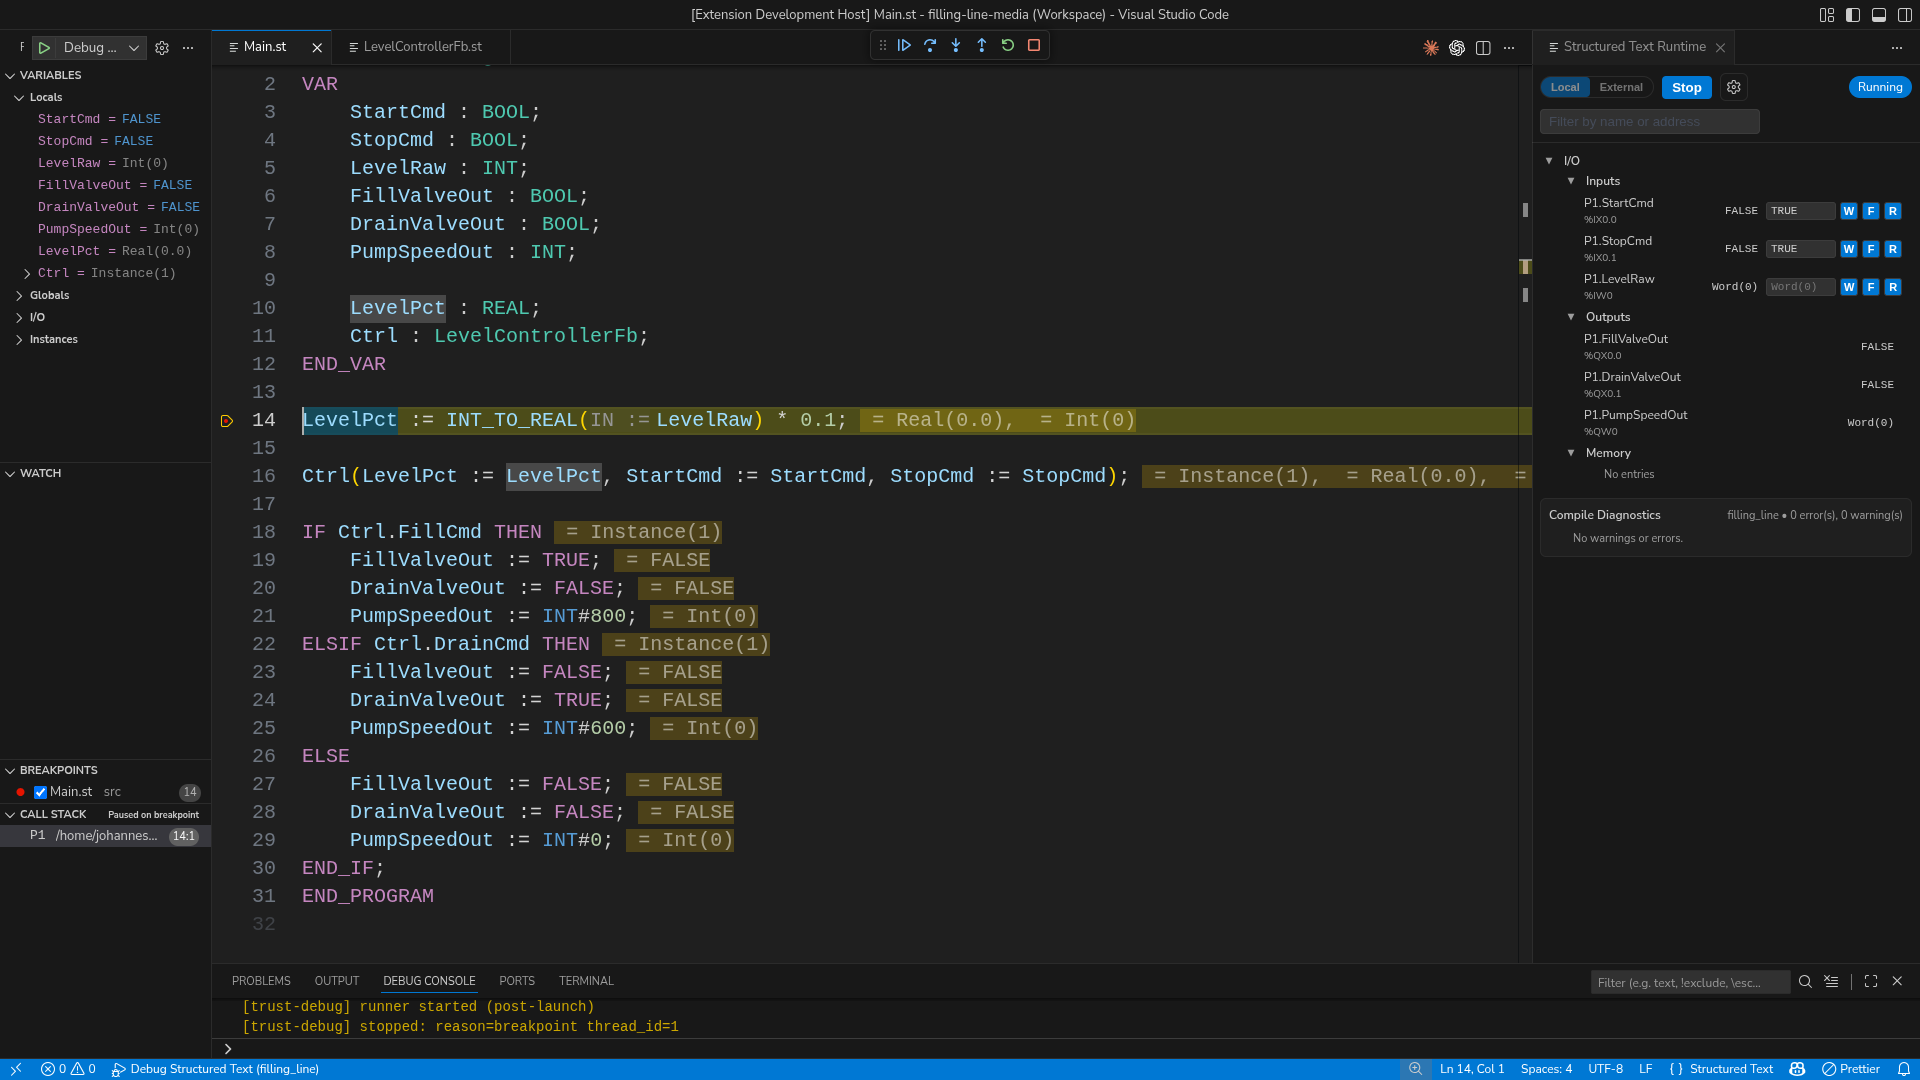
Figure: The debugger paused at a breakpoint with locals, call stack, inline values, and the runtime panel visible beside the code.
Refactor Safely
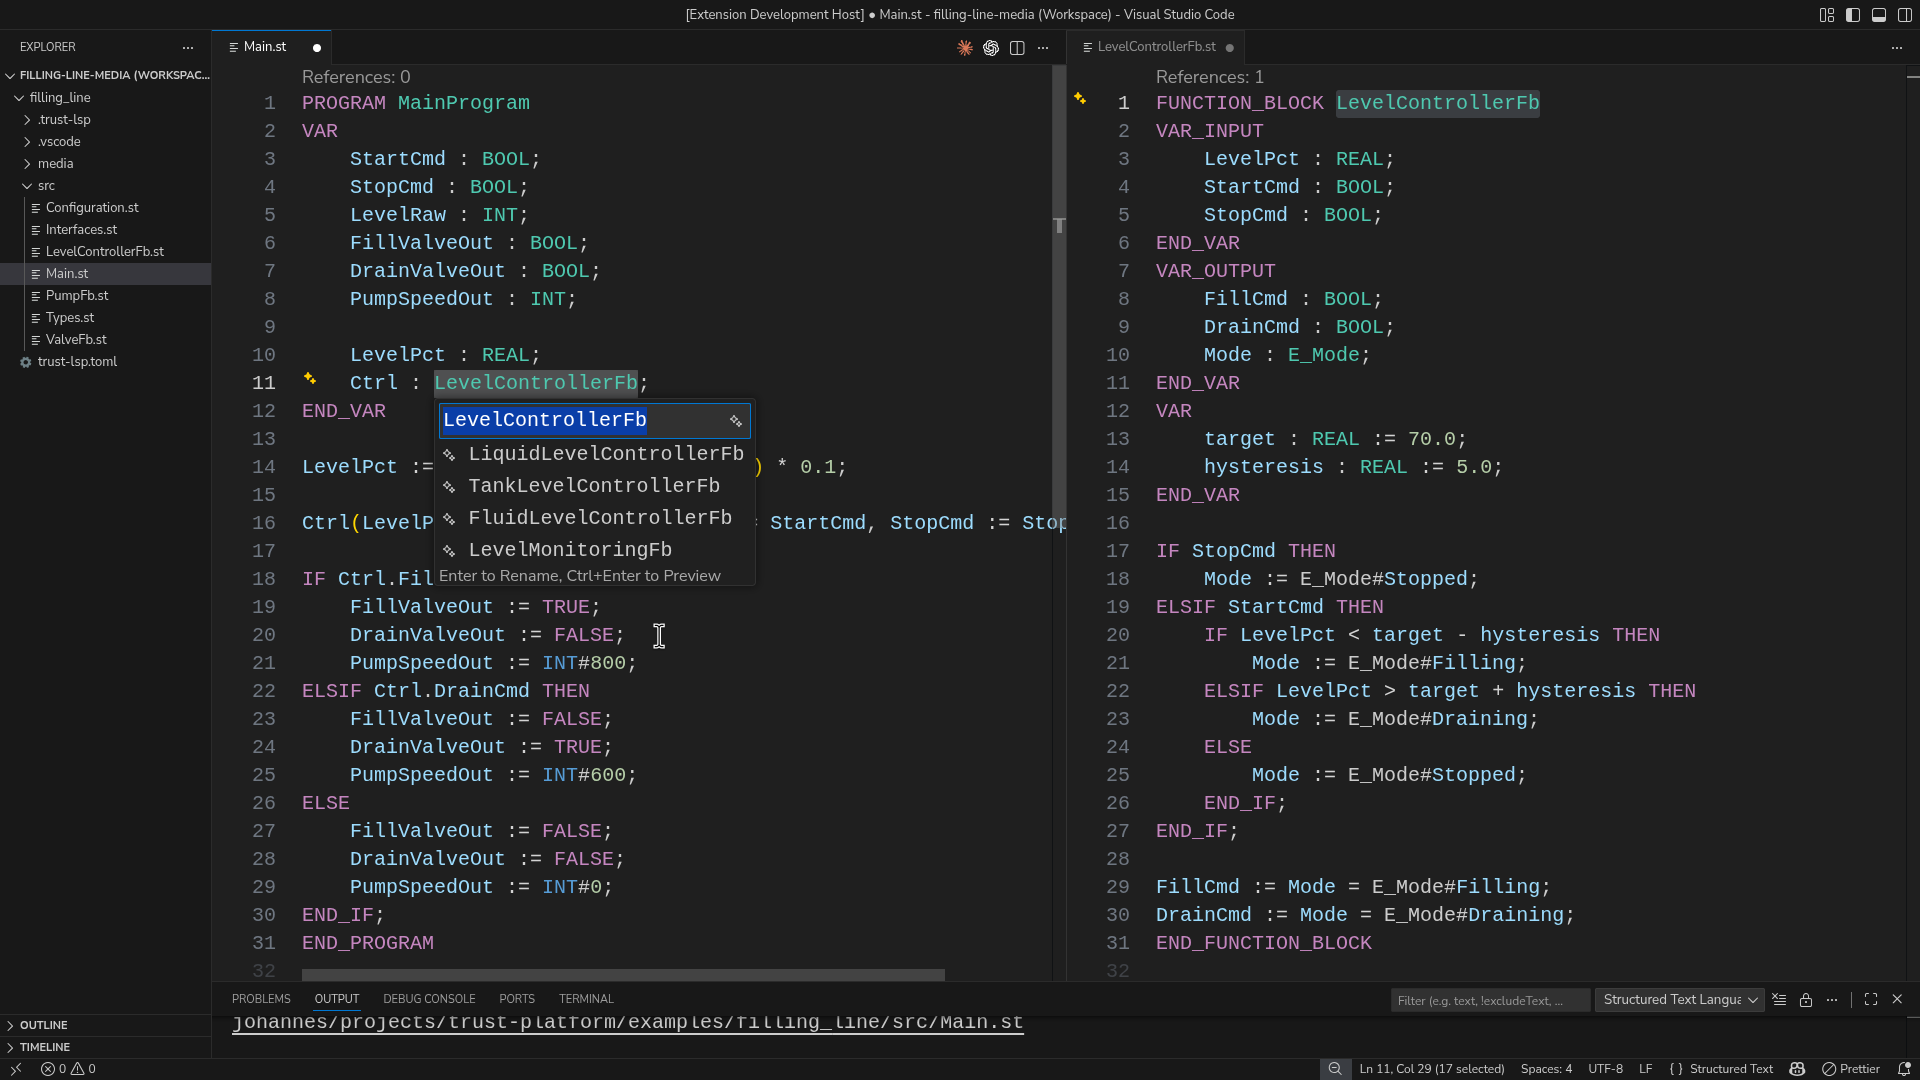
Figure: Rename a Structured Text symbol across files from the editor and preview the affected definition before you apply the change.
Safe Signals In The Tutorial
The tutorial already maps safe proof signals:
%IX0.0=StartCmd%IX0.1=StopCmd%IX0.2=PressureSpikeCmd%IX0.3=BypassCmd%QX0.0=PumpRunning%QX0.1=HighPressureAlarm%QX0.4=BypassOpen
Verify it works:
- toggle
%IX0.0 - confirm the runtime panel changes
- open
/hmifrom the running project for visual confirmation
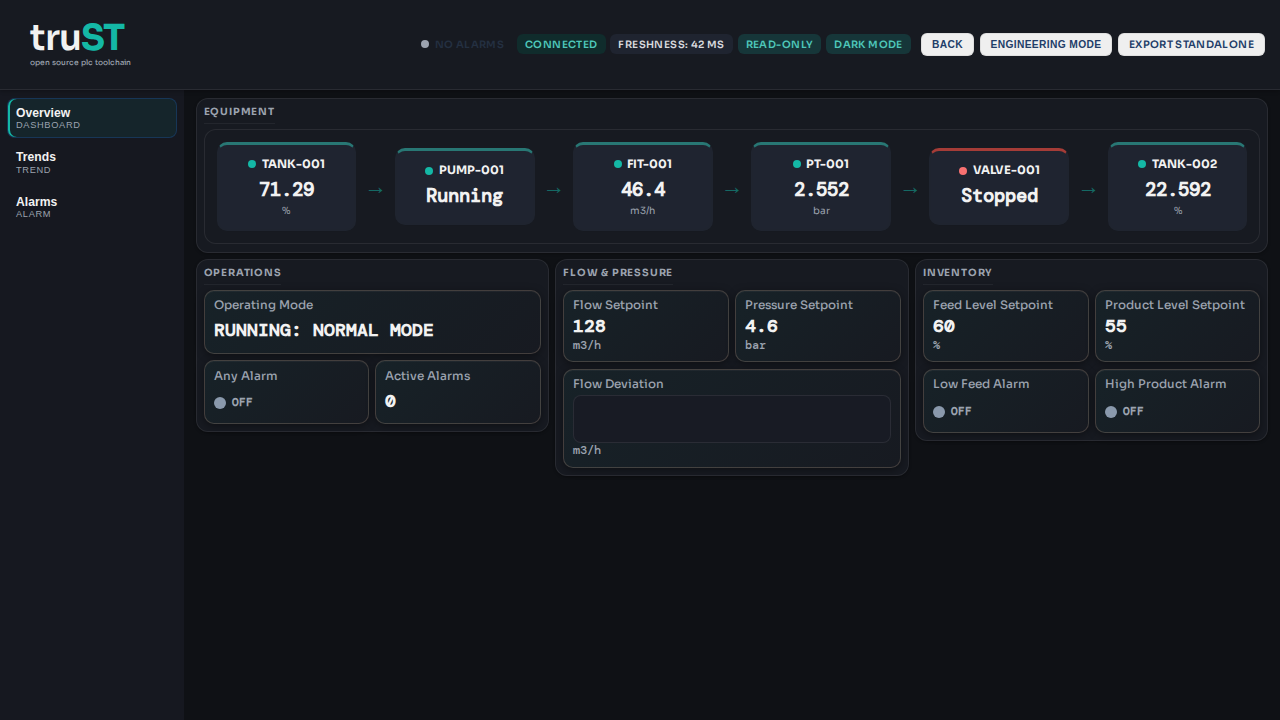
Figure: /hmi for the same shipped tutorial project once the runtime is
connected. Use it as the operator-side confirmation after the editor,
diagnostics, runtime panel, and debugger all look correct.
If It Fails
- no commands in Command Palette: go to Installation
- runtime panel does not connect: go to Debugging And Runtime Panel
- values do not move: go to I/O Binding
- diagnostics appear after your edit: use the clickable Problems panel
- a realistic first failure is a one-letter typo such as
PumpRuninginstead ofPumpRunning; click the Problems entry to jump straight to the bad line