Debugging And Runtime Panel
truST puts the debugger and runtime panel beside your Structured Text code in VS Code.
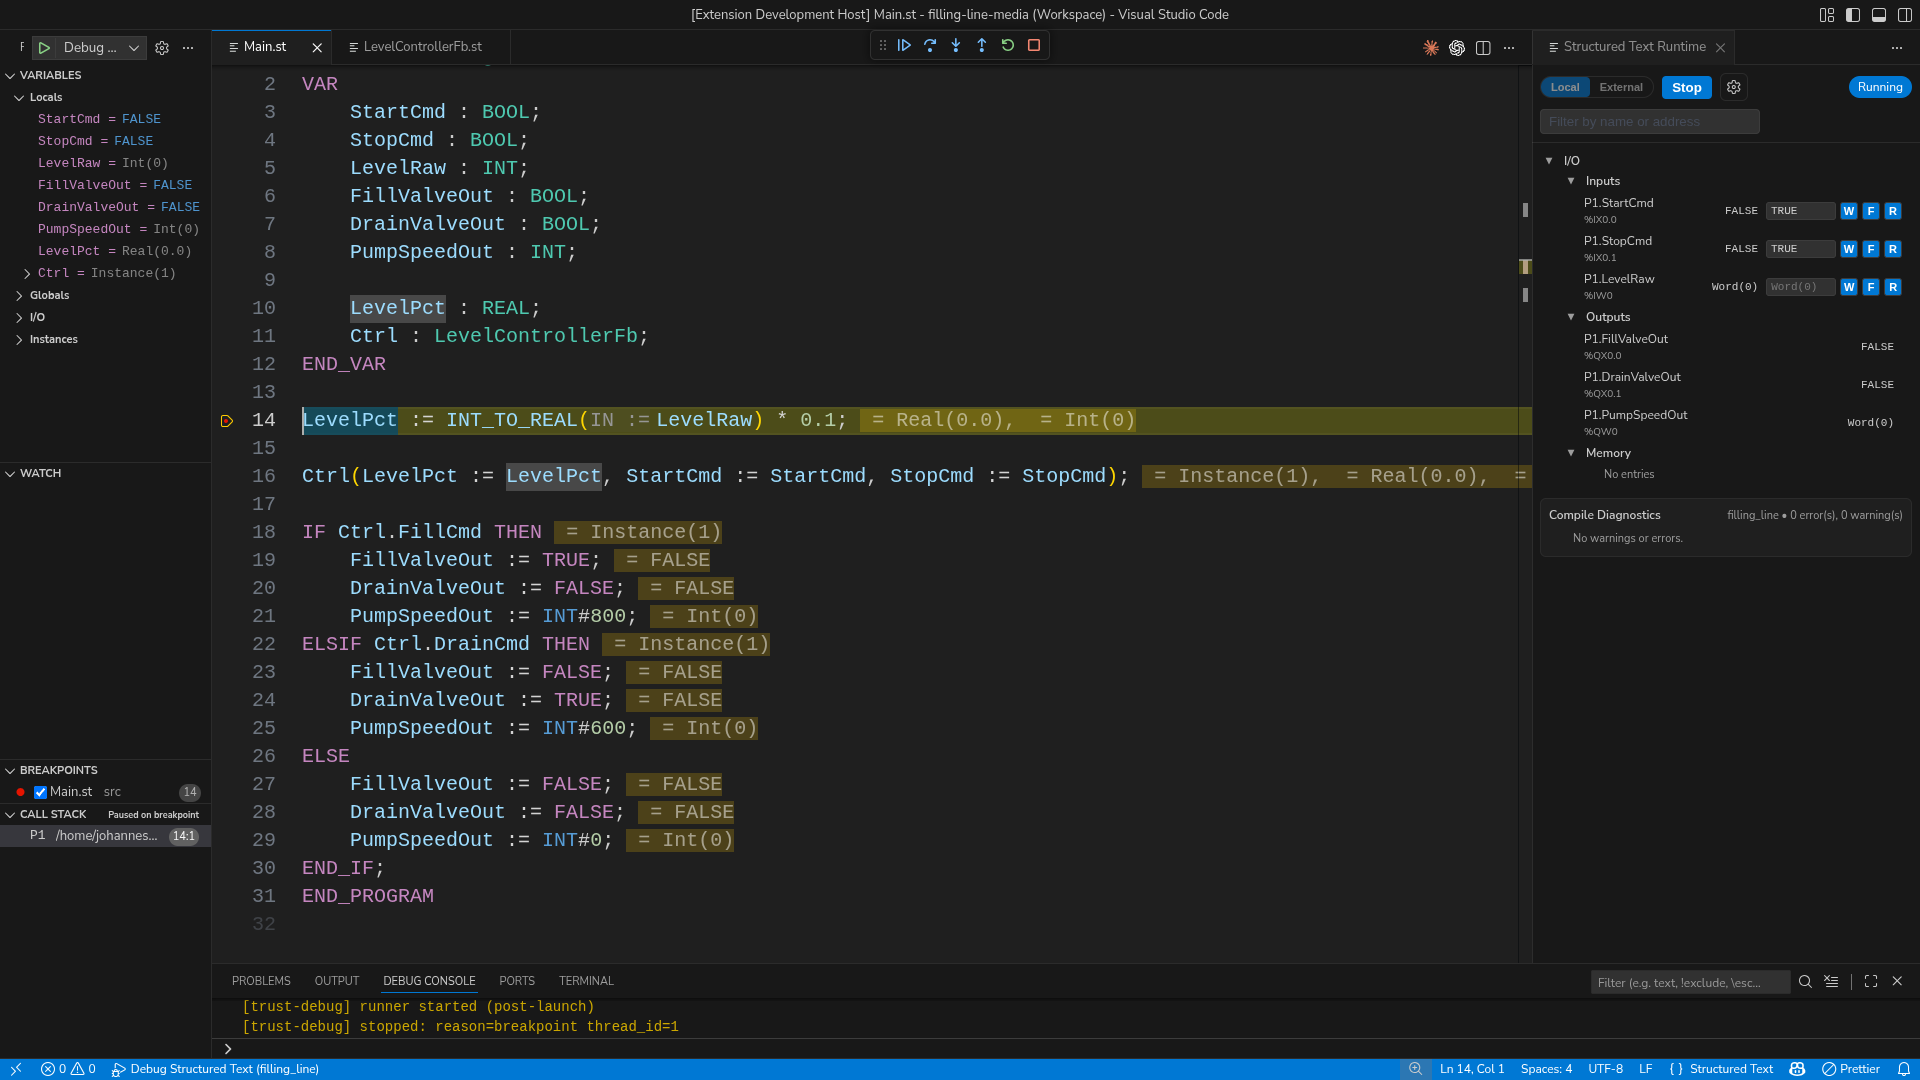
Figure: The debugger paused at a breakpoint with locals, call stack, inline values, and the runtime panel visible beside the code.
What this surface gives you
- breakpoints and stepping at ST statement boundaries
- locals, call stack, and inline values in the editor
- live I/O, memory, and compile diagnostics in the runtime panel
- one project and control endpoint shared by edit, run, and debug
Fast path
- Open a truST project in VS Code.
- Run
Structured Text: Open Runtime Panel. - Choose local or external mode.
- Start the runtime.
- Use
F5when you need breakpoints and stepping.
Runtime panel
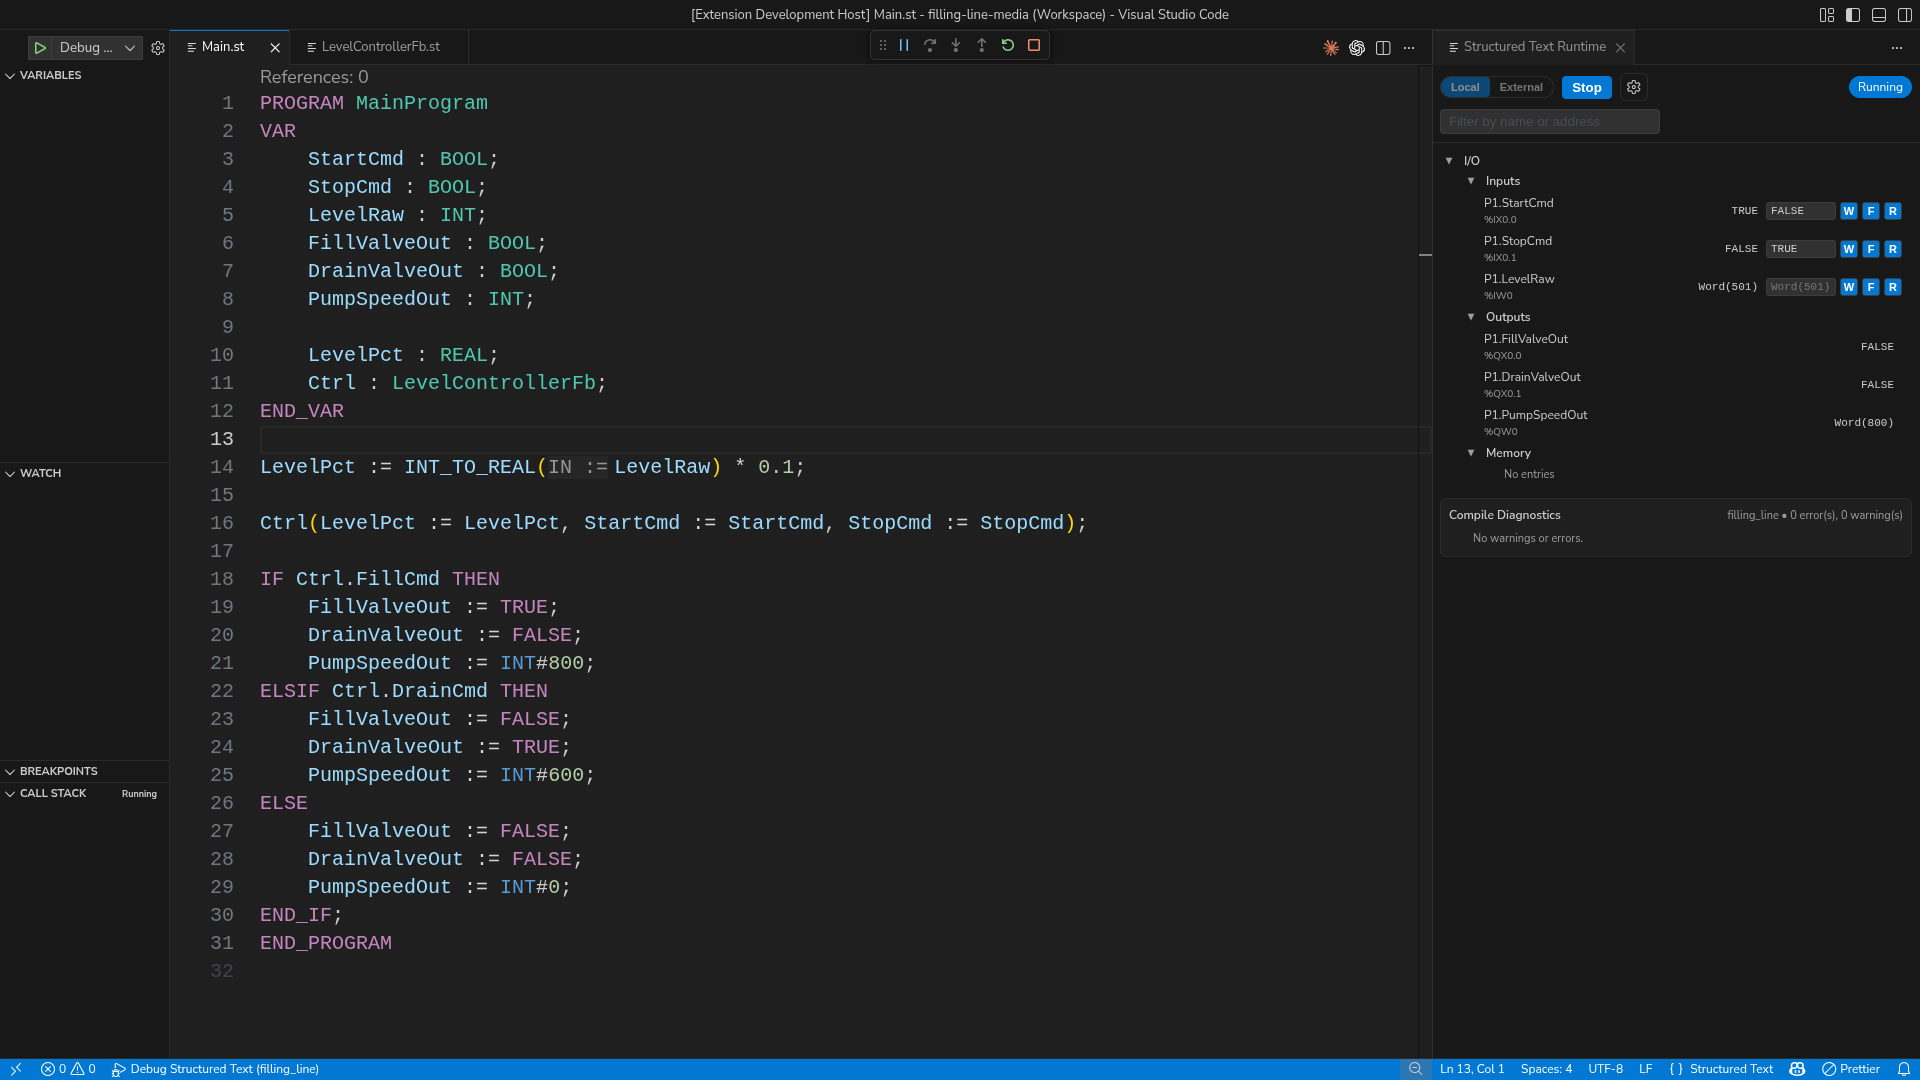
Figure: Desktop VS Code with Structured Text code, the runtime panel docked on the right, live I/O, memory, and compile diagnostics in one window.
Use the runtime panel for:
- live I/O read and quick state checks
- quick local iteration without leaving the editor
- viewing runtime state while editing code
Good panel workflows
| Task | Best surface |
|---|---|
| flip a simulated bit and watch the result | runtime panel |
confirm %I/%Q/%M addresses are mapped as expected |
runtime panel |
| inspect faults, restart, or control connection state | runtime panel |
| debug program flow with breakpoints | debugger |
Common debug scenarios
Output never changes
- Confirm the runtime is actually running.
- Check whether the source variable is mapped in
Configuration.st. - Inspect the runtime panel I/O tree for
%Iand%Qchanges. - If the input changes but output does not, set a breakpoint in the ST logic.
Timer never fires
- Confirm the task is scheduled in
CONFIGURATION. - Confirm the runtime scan is running and not faulted.
- Inspect the timer inputs or elapsed state in debugger or runtime panel.
Type mismatch or impossible write
- Check diagnostics first.
- Confirm the target address class matches the value you are writing.
- Use Build, Validate, Test before assuming the runtime is wrong.
Debugger
Use the debugger when you need:
- breakpoints
- step in / step over / step out
- variable inspection
- inline values
The adapter is trust-debug, and VS Code drives it through the same runtime
control endpoint the rest of truST uses.
Typical debugger flow
- Build and validate the project first.
- Start or attach to the runtime.
- Set a breakpoint in the ST file you care about.
- Press
F5. - Inspect variables, step, and resume until the failure condition is understood.
Browser Runtime Overview
The runtime web UI gives a browser-hosted runtime summary outside VS Code.
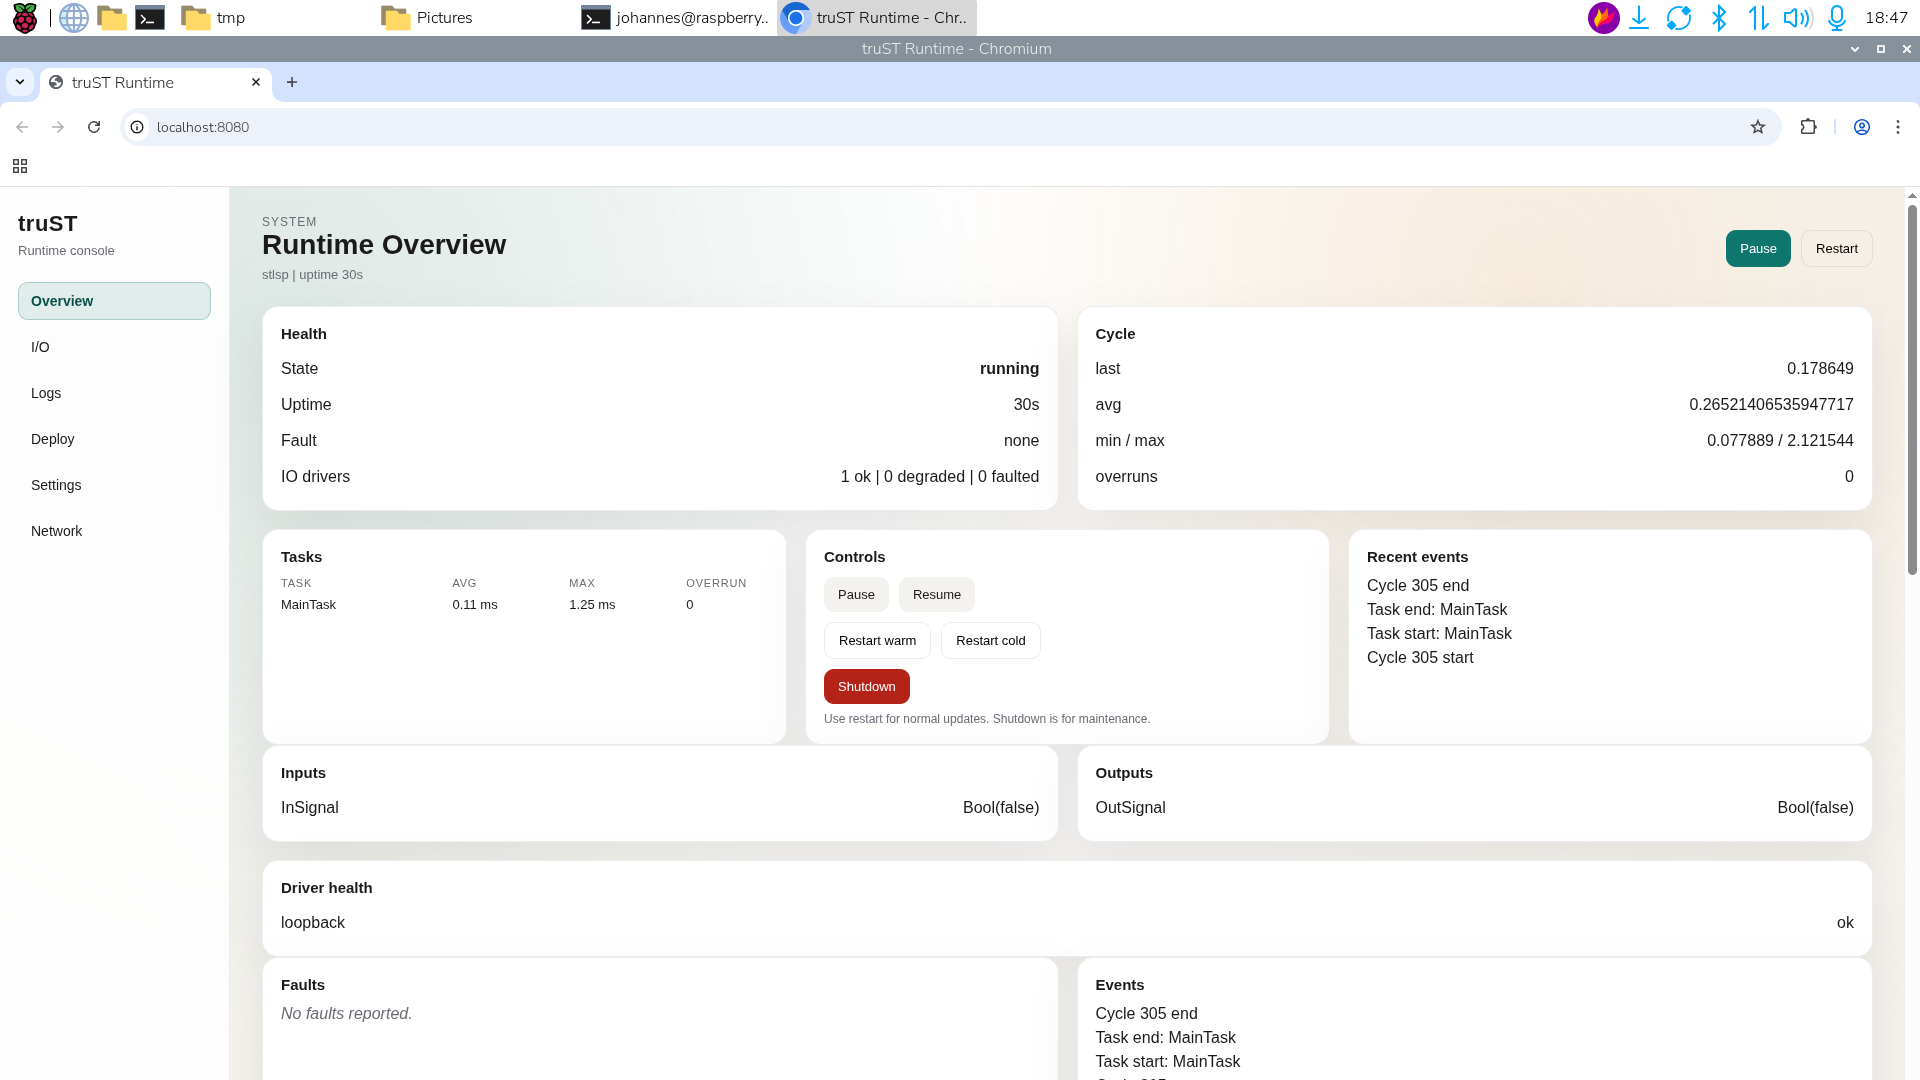
Figure: The browser runtime overview shows health, cycle timing, tasks, and the live input/output summary when you need the same runtime state outside the editor.
When not to use the debugger
- do not start with the debugger when simple diagnostics or a forced I/O check will answer the question faster
- do not treat debugger success as proof that hardware mappings are correct; verify through the runtime panel too