Debugging In VS Code
Pause your program and inspect values line by line with breakpoints, using VS Code's standard debugger.
Debugging is for stepping through logic. To just watch I/O update while the program runs, use Live Values instead.
1. Set a breakpoint
Open src/Main.st and click in the gutter to the left of a line (for example running := TRUE;). A red
dot marks the breakpoint, and it also appears in the Run and Debug view under Breakpoints.
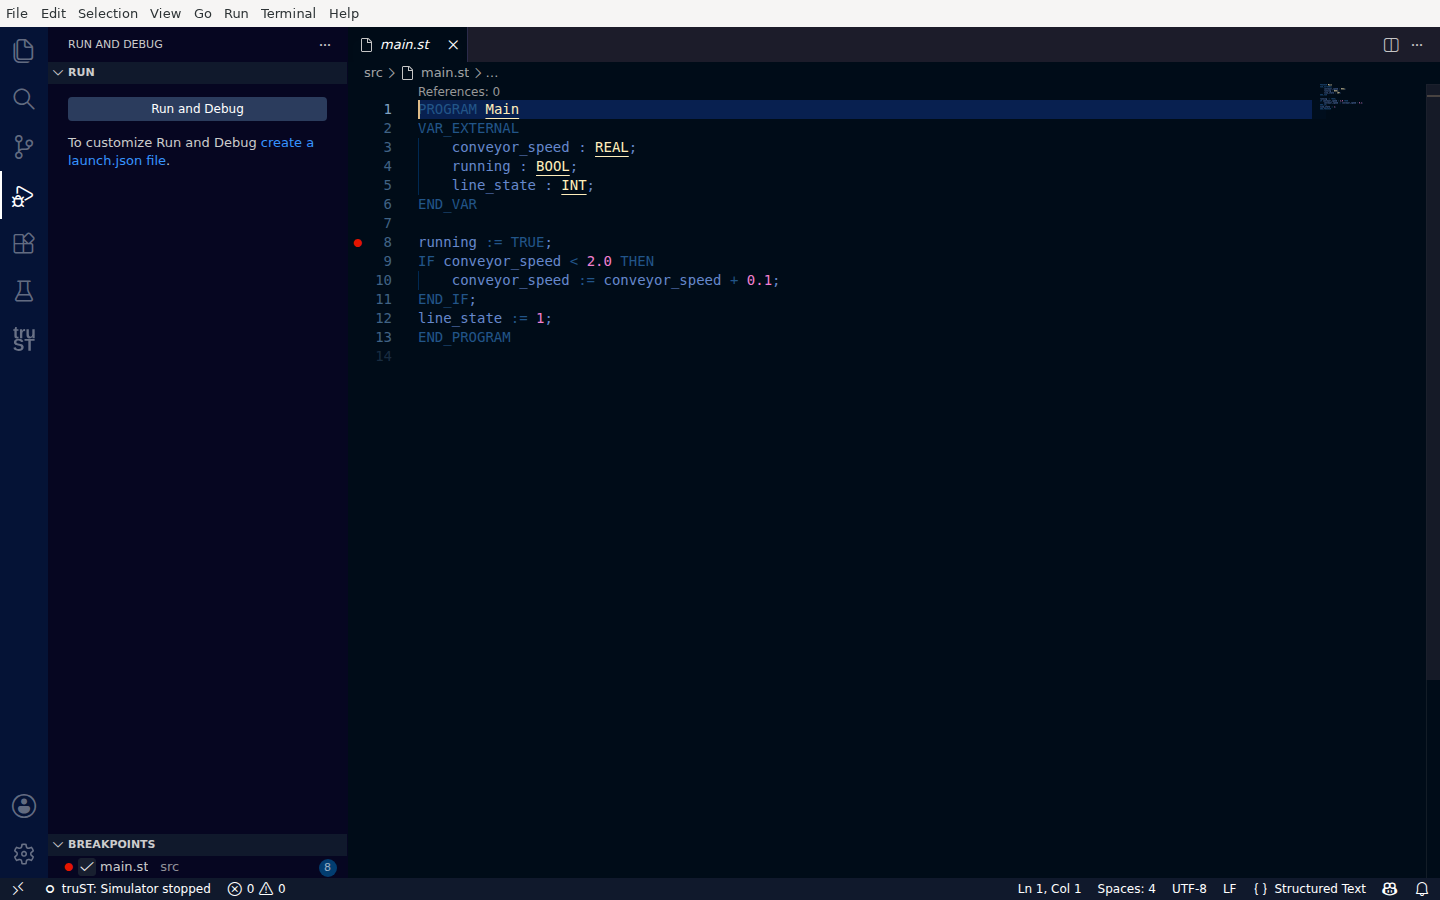
Click the gutter to set a breakpoint — the red dot marks where the program will pause.
2. Start the simulator
Press Start on the Run card (or start from the Run and Debug view). The simulator runs your program; when execution reaches your line, it pauses.
3. The program pauses at your breakpoint
When it pauses you can see, at a glance:
- the current line highlighted with a yellow arrow in the gutter (line 8 here),
- Paused on breakpoint in the Call Stack (
Main), - live values in Variables —
conveyor_speed = Real(1.5),running = FALSE,line_state = Int(1), - the debug toolbar at the top: Continue, Step Over, Step Into, Step Out, Restart, Stop.
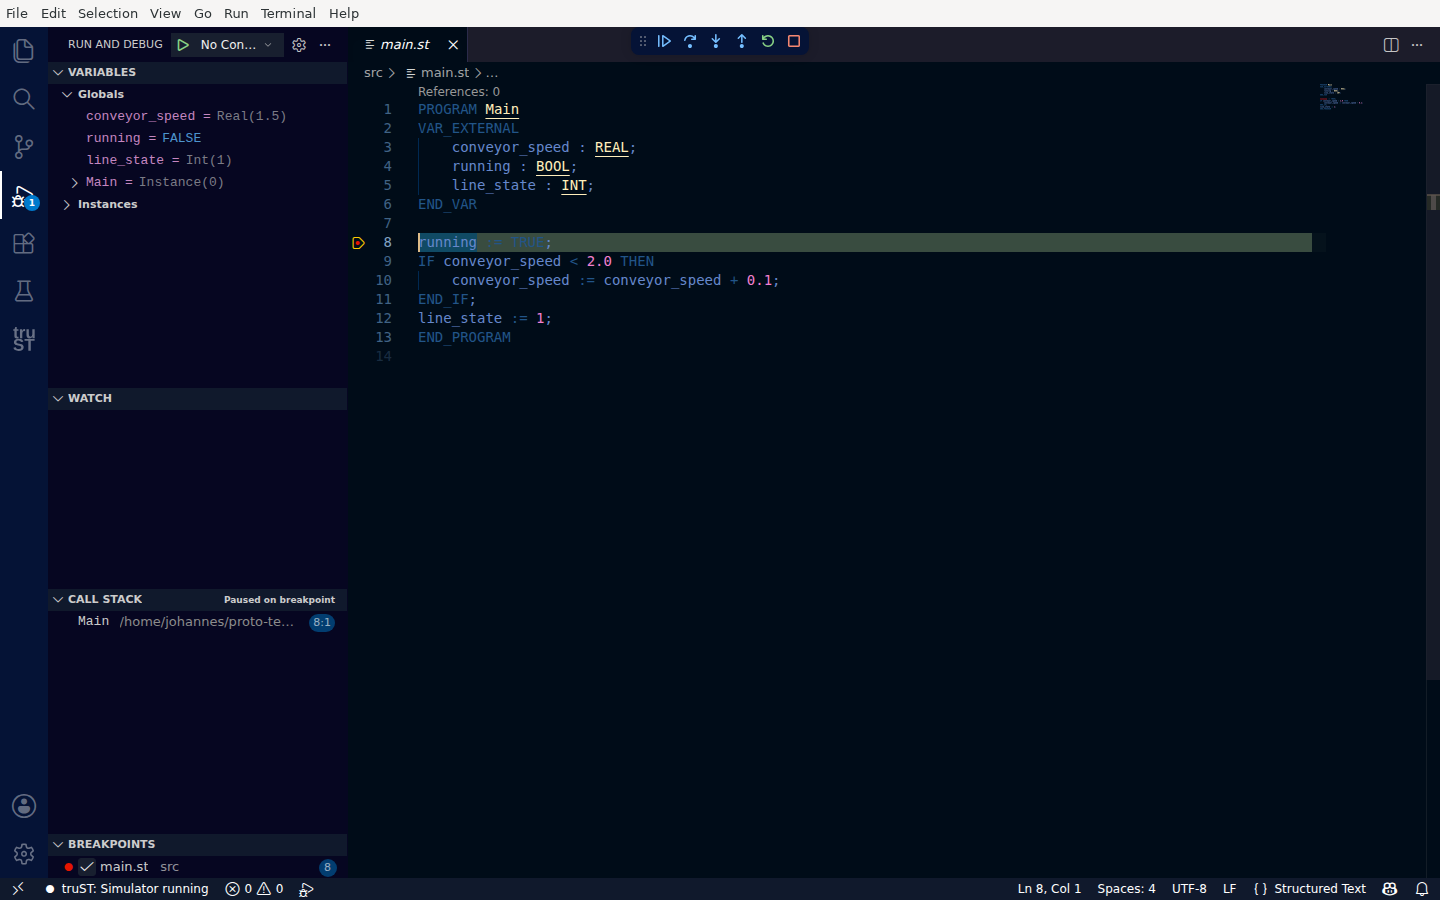
Paused at the breakpoint — the yellow arrow shows the current line, Variables shows live values, and the toolbar gives Continue and Step controls.
Success signal: the yellow current-line arrow, "Paused on breakpoint" in the Call Stack, and real values in Variables.
4. Step through the program
Use the debug toolbar:
- Step Over — run the current line and pause on the next.
- Step Into / Step Out — go into, or return from, a called block.
- Continue — resume until the next breakpoint (or until the next scan cycle hits the same line again).
- Stop — end the debug session.
While paused, you can change a value from Live Values, then Continue and watch the result.